To xG or not xG: that is the question
Data analytics are now an established and integral part of elite football. But how much data is too much data? Or is there no such thing as too much data?
You’ll probably know who Billy Beane is - the former baseball player who became a scout for the Oakland A’s in Major League Baseball and then their general manager from 1997.
And if you don’t know who Beane is, then you’ll know Brad Pitt, who played the role of Beane in the 2011 Oscar-nominated movie Moneyball, based on the 2003 book of the same name by Michael Lewis.
At the heart of the Moneyball story is the notion that the collective wisdom of traditional baseball insiders (not least scouts, managers and coaches) was flawed. Players were often hired based on perception of their physical attributes and other subjective criteria, and (often) not on considerations around hard, objective performance data.
Beane oversaw a revolution in recruitment that sought players who might seem unfashionable but were shown by the data to be hugely undervalued.
The achievements of Oakland were so dramatic they couldn’t be ignored. They had one of the lowest payrolls in MLB in 2002 and 2003 - around one third of the big-spending New York Yankees’ budget in both years - yet the A’s won their division and made the play-offs in both campaigns.
When Moneyball was published in Britain in 2004, a man called Ramm Mylvaganam, the founder of ProZone, sent copies to senior executives at every Premier League club. He wanted to impress upon them that data could be transformational, and encourage them to use his products. Over at OPTA, football’s other major data supplier in 2004, they also sent Moneyball to clubs, for the same reason.
If you have any interest in the way the data story in football has evolved over the past 25 years, then Rory Smith’s book, Expected Goals, published in 2022, is a recommended read. It’s not only comprehensive but accessible, with masses of fascinating background stories about the key characters who have transformed this area of the game.
Re-reading parts of Rory’s book this week, I’m reminded that as recently as 2011, just a handful of the hardcore football data community went to the Sloan Sports Analytics Conference, the major gathering of sports data folk.
Sporting Intelligence was dipping into this territory around the same time and by 2012 we were partnering with Manchester City and their head of performance analytics, Gavin Fleig (a ProZone alumnus) to launch MCFC Analytics, a "game-changing approach to data sharing" that aimed to support and inspire the growing football analytics community.
The thing that prompted me to write this article was a recent episode of The Rest Is Football podcast, a thrice-weekly show in which Gary Lineker, Alan Shearer and Micah Richards discuss and debate all the latest developments in the world of football. (Disclaimer: I have appeared as a guest on their pod and provide occasional editorial support for it).
The recent episode that piqued my interest, and frankly surprised me a little, involved Micah bringing up the subject of xG, or expected goals, specifically in relation to Manchester City’s 1-0 FA Cup semi-final win over Chelsea.
For anyone who isn’t familiar with xG, it is calculated by assessing the likelihood of any shot becoming a goal. Penalties have an xG of 0.76, for example, because, across the board, 76% of penalties are scored.
A shot from one or two yards with the goalkeeper out of position might have an even higher xG, while a long-range free-kick, such as Trent AA’s stunning opener for Liverpool at Fulham recently would have a much lower chance of going in. In fact that free-kick’s xG was 0.06, or in other words, it had a 6% chance of going in, and 94% chance of not.
Different companies calculate xG in slightly different ways, so OPTA said City’s xG in the FA Cup was 0.84 against Chelsea, while Chelsea’s was 1.16. The Athletic said it was 0.86 vs 1.29. In either case, Chelsea probably should have won and if Nicolas Jackson had been more clinical, they would have .
In his first 30 league games this season, Jackson (below) scored 10 goals, although his xG for those games totalled more than 16. In other words, he’d scored six fewer goals than “should”. Ahead of last night’s match with Tottenham, he gave an interview in which he said he has been far too wasteful. Inevitably he then scored last night.
Micah Richard’s mention of xG on TRIF led to a spirited debate where he held a position firmly at one end of the argument (that xG is “really intelligent” and useful) and Alan Shearer had a position at the polar opposite of the debate (that xG is “f***ing shit”). Gary Lineker was somewhere in between, probably slightly sceptical but accepting Micah’s view as valid.
Why did this surprise me? I assume that data is self-evidentially important and valid, at least as one tool among many that can be used to assess performance in modern football, and assist improvement.
If you’re a professional football club, where the aim has always been to win, then making use of anything that might give you a performance advantage is surely a no-brainer.
The notion you’d dismiss xG as pointless is anathema to me. Yes, of course any reasonable neutral fan would conclude Jackson wasn’t clinical - and you don’t need any stats to show you that. But if you use data cleverly, then it is going to help you (and please, whether you agree, or disagree vehemently, I’d be interested to know, and why, in the comments).
As recently as November 2017, Jeff Stelling famously broadcast to the nation that xG was “the most useless stat in the history of football.”
It goes without saying that we remain closer to the start of football’s journey with data than the endgame. Goodness knows what impact AI will continue to have in the coming years. But football data is here to stay, and an industry in its own right.
Anyone au fait with the subject will already be thinking this piece is somewhere below entry level. Yet I am still often surprised at how many hardcore football fans, who probably spend more time, money and emotional energy on their team than on anything else, either know quite little about analytics, or care less. I suppose this piece is primarily for them.
So what is xG?
An academic study as long ago as 2004, using data from the 2002 World Cup, found that one in 10 shots were scored (or 93 from 930 across 37 matches). In that case, the “average” shot had a 10% chance of being a goal, and therefore an xG, had it existed then, of 0.1xG. Various other studies developed the idea without coining the phrase before Sam Green of OPTA brought it into the mainstream (sort of) in 2012.
As OPTA’s website says: “Expected goals (or xG) measures the quality of a chance by calculating the likelihood that it will be scored by using information on similar shots in the past. We use nearly one million shots from OPTA’s historical database to measure xG on a scale between zero and one, where zero represents a chance that is impossible to score, and one represents a chance that a player would be expected to score every single time.”
The model evaluates how more than 20 variables affect the likelihood of a goal being scored. Some of the most important are listed below:
Distance to the goal. Angle to the goal. Goalkeeper position, giving us information on the likelihood that they’re able to make a save. The clarity the shooter has of the goal mouth, based on the positions of other players. The amount of pressure they are under from the opposition defenders. Shot type, such as which foot the shooter used or whether it was a volley/header/one-on-one. Pattern of play (open play, fast break, direct free-kick, corner kick, throw-in). Information on the previous action, such as the type of assist (through ball, cross etc).
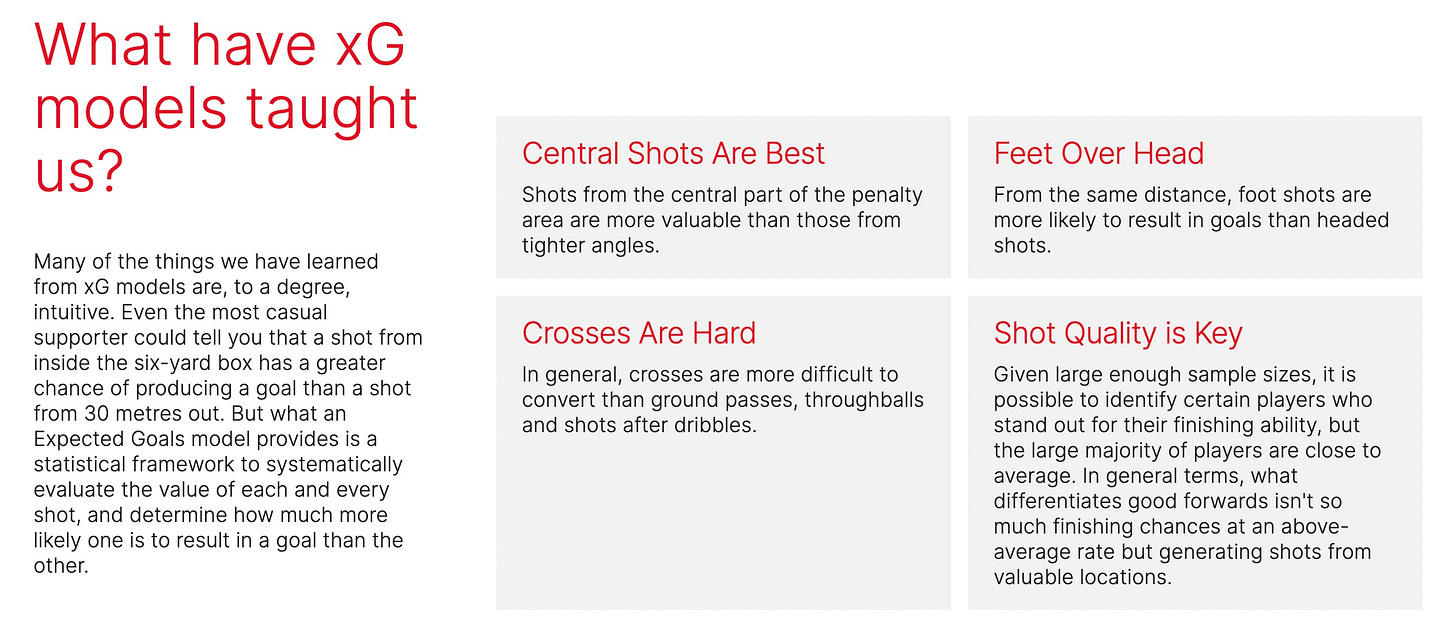
Meanwhile, another well-established analytics firm that works with major clubs, StatsBomb, explain their own xG methodology here, and delve into the practical uses for the metric. The different xG models each have their own unique quirks. StatsBomb’s xG for a penalty, for example, since 2022 at least, has been 0.78 as opposed to 0.76.
Aside from the StatsBomb section on what xG models have taught us (below), they also explain how xG can be used for team and player analysis, scouting, predictive modelling and more.
Contrary to the headline on this article, this piece is not really about xG, per se, but about data. Are you a traditional “football man” (or football woman)? Or do you think there’s a place for stats and data that can play a fundamental role in the beautiful game?
What follows are five examples of data being used in football in recent decades. Clearly this is a far from exhaustive study … I’ve only left out hundreds of other potential examples.
Allardyce the innovator
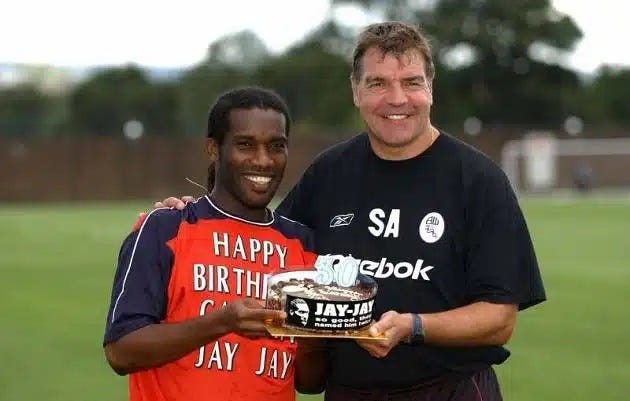
Before Billy Beane had worked his magic in California in the early Noughties, Sam Allardyce, aka Big Sam, characterised as a long-ball merchant, was the first manager outside England’s top division to bring ProZone into a club, at Bolton. ProZone provided him with an analyst, Dave Fallows (later to work at Manchester City and Liverpool), and Allardyce hired two other analysts: Gavin Fleig, already mentioned above, and Ed Sulley, who would go on to spend 11 years with City Football Group.
By the time Allardyce got Bolton back into the Premier League in 2001-02, he had put together, as Rory Smith described it in his book, “the first data-driven team, certainly in football and possibly in sport more broadly.”
As Rory writes in his book:
“He knew that, if his team kept 16 clean sheets over the course of a 38-game season, it would not be relegated. He knew that if his team scored first, it would have a 70 per cent chance of winning a game. He knew that if his players covered more distance at a speed above 5.5 metres per second than their opponents, their chances of winning would go through the roof. And he knew that a third of all goals came from set-pieces. He knew all that, rather than believed it, because that is what the numbers told him. And so he built a team in accordance with the knowledge that he had gleaned.”

Data informed the tactics, from the switch to a defensive stance after losing a ball in a turnover to using in-swinging corners, which have a higher chance of ending in a goal. Allardyce hired a 34-year-old Gary Speed on the basis of Speed’s output data and got four productive years from him.
Allardyce’s often blunt manner and the style of play of some of his teams saw him often derided as a dinosaur, but in terms of embracing technology and data, he was well ahead of the game.
How Arsenal played the numbers game
Arsenal bought StatDNA, a US-based data analytics company founded by Jaeson Rosenfeld, for £2.165m in December 2012, although they were super secretive about precisely how the company would operate as an in-house entity. The club’s CEO at the time, Ivan Gazidis, was particularly sensitive about keeping their activity confidential because he knew the Gunners could gain a significant competitive advantage if they used StatDNA well.
“The insights produced by the company are widely used across our football operations – in scouting and talent identification, in game preparation, in post-match analysis and in gaining tactical insights,” he said.
“The analysis that StatDNA undertakes is highly technical and IT-based. Therefore, the true value of the operation is in its proprietary data, its computer programmes, its algorithms, its analysis methodologies, which it has developed and owned, and its people.”
Arsenal had already been commissioning work from Rosenfeld for a year and had been impressed that his methods were not just equal to the products already being used from ProZone and OPTA but much more sophisticated in other ways.
There are plenty of long reads on Arsenal and StatDNA, and how they relationship gelled, and at times didn’t. Pieces here and here are both interesting, while a more general but detailed read on data by Adam Crafton in The Athletic includes some StatDNA background. This podcast on Simon Austin’s Training Ground Guru site is recommended; it’s an interview with Sarah Rudd (below), vice- president of analytics and software development for StatDNA and Arsenal for almost a decade before she set up her own consultancy. She talks about her career, her work with Arsenal and the future of analytics.
Arsene Wenger was fully invested in StatDNA’s work and had a good working relationship with Rosenfeld, who left Arsenal in 2020 to join Wenger at FIFA, as an advisor on advanced analytics. But not everyone at the club always backed the StatDNA data, not least for scouting analytics. When StatDNA recommend a player at Werder Bremen in 2012-13 and another at Red Bull Salzburg around the same time, key scouting staff were unimpressed by either Kevin de Bruyne or Sadio Mané.
I worked for a short while in 2017 with StatDNA on an Arsenal project after Rosenfeld contacted me about Sporting Intelligence’s series of Global Sports Salaries Surveys. The most recent edition at that time was the GSSS 2016 and I was working on the GSSS 2017.
Rosenfeld and StatDNA wanted to build their own salary database tool that could effectively pinpoint pretty much what any footballer in Europe was earning, given their age, skill set, club, experience and so on. The point of this was that if would give Arsenal a benchmark on what to reasonably offer in contract negotiations to new signings, to ensure the target was well paid but not to overpay. My input involved sharing salary data sets from my own work and analysis on wage structures in different places to feed into the model.
The reason Arsenal wanted their own database was because they couldn’t trust anyone, including other clubs and especially player agents, to be transparent about what players earned.
Arsenal’s total salary bill in recent seasons has been considerably lower that their main title rivals at both Manchester clubs, Liverpool and Chelsea. I obviously claim credit for anything good that’s happened at Arsenal in that time!
The miracle of Leicester
Leicester shocked the football world by winning the Premier League title in 2016, having started the season as 5,000-1 outsiders. Bookies said it was the longest-odds success that has ever been gambled on, not just in sport but for any event in human history.
Very few events with odds of 1,000-1 or more have ever successfully ended in wins. One that did was a bet placed in 1964 by a man from Preston called David Threlfall, who bet £10 at 1,000-1 that a man would walk on the moon before the end of the decade. It happened in 1969. Threlfall won £10,000 and bought himself a sports car, in which he was killed in a crash.
Leicester’s 5,000-1 win was astonishing, and data played a role. ProZone had been supplying data, analytical tools and wearable tech to the club for a decade by this point.
In the title-winning season the Foxes were using ProZone3 tracking data to support “the enhanced assessment of player fitness and conditioning”. Leicester had the fewest injuries of any club in the Premier League that season.
Leicester also used OptimEye S5, a wearable from tech firm Catapult, to “establish the risk of a player getting injured at any given time based on benchmark data that automatically shows when they have exceeded their usual workload”. They also used OptaPro products, but neither the club nor firm would comment at the time on specifics, such is the secrecy around these areas.
A lot of the tech and data was encouraged under Nigel Pearson before he lost his job as manager, having saved Leicester from relegation the season before.
Red Bull Salzburg - a transfer policy with wings
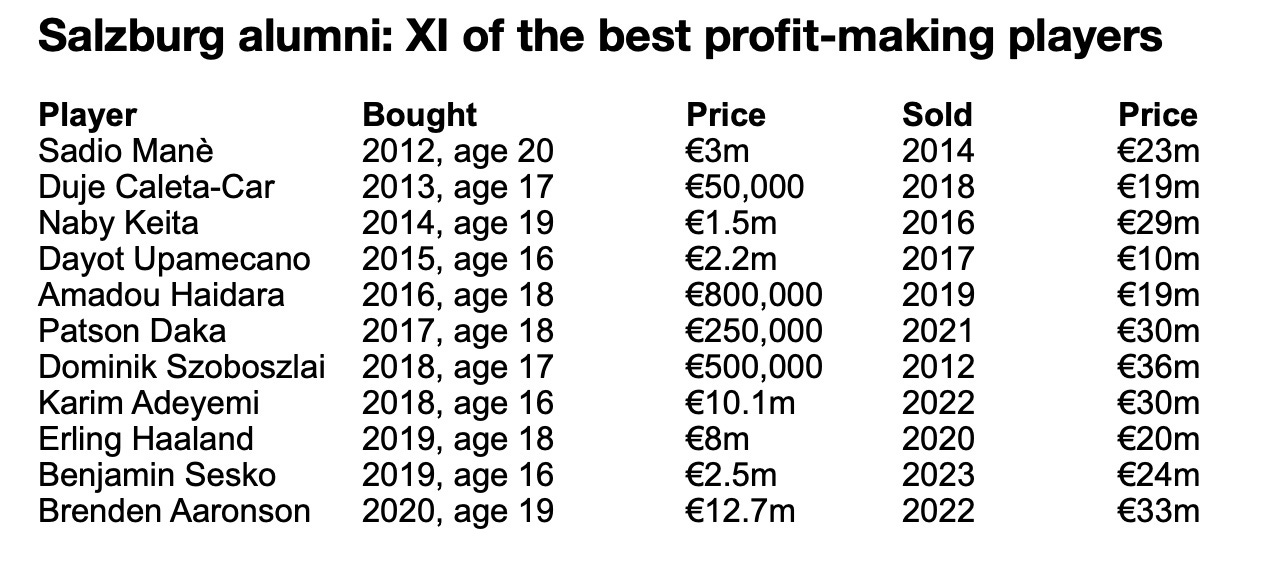
Salzburg’s recruitment strategy has been famously profitable for them and works on the basis that that they have specific predefined characteristics for every position on the field. Data is at the heart of their initial scouting process, with hundreds of thousands of players from the youngest age groups upwards being monitored.
The vast majority won’t be a fit, of course, but the hundreds who look like they might are then physically scouted and assessed for temperament. At any given time, the club may have a dozen or more potential candidates for every position in the squad, typically young and relatively cheap. When a new player is required, there are multiple options in the internal system, and the scouting has already been done.
Brighton rocks (in recruitment at least)
Brighton and Hove Albion have been one of the success stories in English football over recent decades. As recently as 2000-01 they were playing in the fourth tier of the pyramid, and for two successive seasons in the late 1990s they finished in 23rd place in that division, narrowly avoiding the sporting catastrophe of relegation to the non-league.
Yet now they are playing a seventh successive season of Premier League football, finishing as high as sixth in the top-flight table last season, earning the right to play European club football this season for the first time in their 122-year history. They topped their group in the Europa League this season before being beaten by Roma of Italy in the last 16.
I had the privilege of spending 10 days behind the scenes at Brighton last September in the week in which they played their first ever European fixture. They have a massively impressive set-up across the club, and I spent time with CEO Paul Barber, manager Roberto De Zerbi, technical director David Weir and the whole gamut of executives from the club lawyer and commercial director to the new head chef, the head of retail, the kit man, the head of player liaison, the social media manager, the shop staff and more.
I was allowed full access to the stadium, including the dressing room, and the training complex, including the gym, the spa and the canteens, and was also allowed to watch training and spend time with the players. I wrote a day-by-day diary of my time there, as well as various other one-to-one interviews with key members of staff.
There are many things that Brighton do well, and recruitment is one of them, underpinned by ‘secret sauce’ data that comes from the StarLizard data company that informs much of Brighton owner Tony Bloom’s professional gambling. That data is massively complex, proprietary, exclusive to Brighton among football clubs, and evidently best-in-class, tracking more players in more places via more metrics than any comparable system.
I asked David Weir whether this data is basically a clever algorithm? “It’s an objective measure that challenges your subjective opinion … fundamentally [the output] is a determinant of quality,” he said. Which is basically a “yes”.
He added: “No doubt data is very important but we also have eyes on players. It’s not just a numbers game … Recruitment is a combination of lots of things [including data, traditional scouting, background checks] … We’ve been really lauded for recruitment but it’s also about [our reputation for] how players are treated and looked after when they’re here … We give young players opportunities.”
On that subject, a recent study by the CIES Football Observatory in Switzerland produced a list of what is, in effect, the best 100 players from around the world who are yet to reach the age of 20. The methodology involves the number of minutes played by each person to date in their careers, weighted for the quality of the leagues and national teams they are playing for. No fewer than four Brighton players are in this list of 100 players: Evan Ferguson, Facundo Buonanotte, Valentin Barco and Jack Hinshelwood, all aged 19.
As well as data, Brighton also, famously, have a “no dickheads” policy. Even if they find a transfer target whose numbers are off the scale and mark him out as the next great star, they won’t make an approach to buy unless that player has also passed various temperament checks.
A perusal of Brighton’s transfer dealings in recent years confirms that their policy of buying young and low, and selling high, has been consistent. You can be certain that every rival club is seeking a similarly effective method, with data being a vital part of it, xG and all.
If you enjoyed this piece, please consider becoming a paid subscriber. There will continue to be regular free pieces for all readers, but from later this month I’ll be running a major, in-depth series each month on one particular subject - and these series, which will run across several days, will be exclusively for paid subscribers.
I’m currently working on a major project for later this month on football ticket prices, always a hot topic. In June the major series will revolve around Euro 24, including predicting the winner based on the insurable value of the players, while in July there will be a Wimbledon special, which will include a deep dive into a match-fixing doper in SW19. Don’t miss out - sign up now!


Really interesting piece. What I find frustrating is the unnecessarily polarised nature of the debate. Feels like there are distinct camps ‘Data rules OK’ vs ‘Data is rubbish’. Whereas like with most things, it’s nuanced