The Premier League: not as (accurately) predictable as you think

By Roger Pielke Jr 26 May 2015
Another Premier League season is in the history books, and with it another campaign where we can now assess the accuracy of forecasts made about the season. Once again, we learn that skillful prediction is really, really hard.
Here I evaluate 60 predictions by fans, journalists, analytics experts and a few betting companies of the final Premier League table that were (mostly) made before the season began. The predictions have been made available courtesy of Simon Gleave (@simongleave), head of analysis at Dutch Sports data company Infostrada Sports and James Grayson (@jameswgrayson and blog) – so thanks to them for sharing the data.
There are many ways to evaluate how good predictions are and debating what methods are best is worthwhile (e.g., Simon and James offer some alternatives). But it is usually best to have those debates before the evaluation starts, because the choice of evaluation approach can lead to better or worse results for a particular prediction.
The method that I use here is one that I have employed on frequent occasions to evaluate predictions, mostly recently the forecasts of the British election results. The method is straightforward. I first select a “naïve baseline” which you might think of as a very simple prediction requiring no (or very little) analysis.
Here I use as a naïve baseline prediction the 2013-14 Premier League final table. In other words, a really simple prediction of the 2014-15 season made before that season begins is that teams will finish in the exact same order as they did in 2013-14.
Predictive skill then is defined as how much any forecast of the 2014-15 season improves upon that naïve baseline, or indeed is worse than that baseline. After all, you don’t have to know anything about football to come up with that simple prediction. It would be logical to think that beating this simple prediction would be pretty easy for betting houses, quantitative analysts, sports journalists and fans – each of whom spends a lot of time watching the game and exploring its nuances.
Think again.
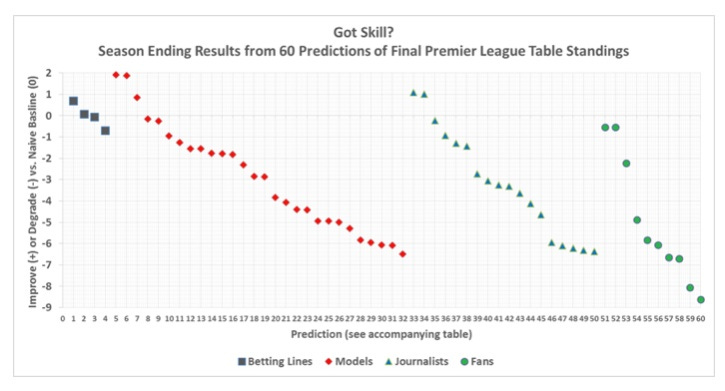
The table below shows the results for the betting lines (4 predictions), models (28), journalists (18) and fans (10). The zero value on the y-axis indicates the threshold of having skill over the naïve baseline. A positive value means that the prediction improved over the naïve baseline and a negative value means that it subtracted value from the simple prediction.
Article continues below

.
The results show that two of the four betting lines did better than the naïve baseline and two did worse, with their average equaling the naïve baseline. It is fair to conclude that the betting lines together equaled the naïve baseline. Only three of the 28 models – various quantitative approaches to forecasting the league table - improved upon the simple prediction. For journalists and fans it is no better, two of 18 and zero from 10 respectively. Overall, the models, journalists and fans collectively did much worse than the naïve forecast.
Before we explore the detail, let's recap specifically the technical details of how we calculate the accuracy of the naïve baseline, and indeed all the other predictions.
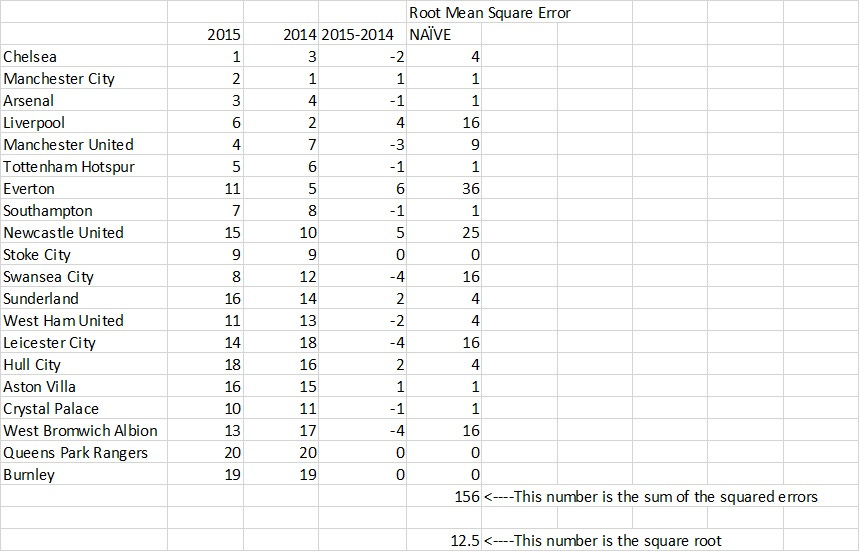
This next graph shows you the finishing position in 2014-15 in the first column (2015), and the "naïve" prediction in the second column, using solely the 2013-14 finishing positions, a tool accessible to somebody with zero knowledge of football or the Premier League. The third column shows how many places different the actual finishing order was from the naïve prediction.
Title winners Chelsea were two places different, Manchester City and Arsenal one each, Liverpool four, Manchester United three and so on. So most were really not far off. So how do we quantify the accuracy of that in a single number? We calculate a 'Root Mean Square Error' (RMSE), commonly used in forecast evaluation.
This is a four-step process:
1. For each prediction identify the error, in this case, the number of table places off for each team.
2. Square those 20 errors, to remove the negatives.
3. Add them up.
4. Take the square root to return to the original units.
And so we arrive at an accuracy figure for the naïve prediction, as below, which has an RMSE of 12.5.
Article continues below

.
Having an RMSE of 12.5 is really quite good, which is why the naïve prediction is so hard to beat. The object of this evaluation is to assess how much predictive skill by various experts outweighed the performance that could have been achieved with zero knowledge of the league.
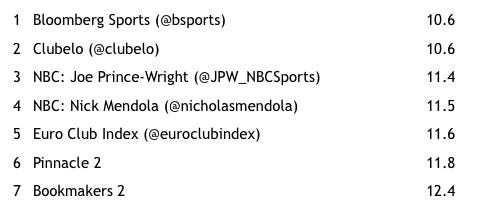
Here are the rankings of the seven predictions (of 60) that did beat the naïve baseline:
Article continues below

The numbers on the right are the RMSE figures for each of those predictors, compared to the 12.5 of the naïve forecast. At the bottom of this post is a table with all 60 predictions, which correspond to the X-axis labels in the top graph.
A full spreadsheet of all the original predictions, as collected by Simon Gleave, is available as a download at the bottom of the piece linked here. Some individual forecasters have begun to reflect on their own forecasts. Phil McNulty at the BBC, one of the most accurate among the media forecasters, writes about his own picks - and what happened to them - here.
What can we learn from this exercise?
Well, one thing is that it is not just elections that are difficult to predict. Sport provides a great laboratory for testing our knowledge. After all, if we can’t improve upon a simple prediction in a sporting contest, what hope is there for predicting outcomes in far more complex societal settings? Not much, I’d say.
So should we just give up and not try to predict the future? No, we should keep trying to predict sport and other outcomes. It helps to keep us humble and it's fun too. But to really understand our predictive capabilities (or more likely, lack thereof) we have to more than just forecast outcomes, we have to evaluate them too, even if the resulting picture is not so pretty.
Simon Gleave would welcome more journalists to make predictions for next season, and if you would like to take part, get in touch with him via Twitter. Simon and James have their own alternative interpretation of this season, and that can now be read here.
.
Roger Pielke Jr. is a professor of environmental studies at the University of Colorado, where he also directs its Center for Science and technology Policy Research. He studies, teaches and writes about science, innovation, politics and sports. He has written for The New York Times, The Guardian, FiveThirtyEight, and The Wall Street Journal among many other places. He is thrilled to join Sportingintelligence as a regular contributor. Follow Roger on Twitter: @RogerPielkeJR and on his blog . More from Roger Pielke Jr Follow SPORTINGINTELLIGENCE on Twitter . The RMSE of the 60 predictions. Bookmakers in red. Models in blue. Journalists in green. Fans in purple.
1
Pinnacle 2
11.8
2
Bookmakers 2
12.4
3
Pinnacle (@pinnaclesports)
12.5
4
Bookmakers
13.2
5
Bloomberg Sports (@bsports)
10.6
6
Clubelo (@clubelo)
10.6
7
Euro Club Index (@euroclubindex)
11.6
8
John Bassett POST (@johnbassett82)
12.6
9
John Bassett (@johnbassett82)
12.7
10
Stats Snakeoil
13.4
11
Paul Riley (@footballfactman)
13.7
12
John Bassett w/o transfer adjustment (@johnbassett82)
14.0
13
DingoR
14.0
14
Stephen McCarthy (@stemc74)
14.2
15
Simon Rowlands (@RowleyfileTF)
14.3
16
Decision Technology (@dectechsports)
14.3
17
Michael Caley POST (@MC_of_A)
14.8
18
Steve Lawrence (@stevelawrence_)
15.3
19
James Grayson (@jameswgrayson)
15.4
20
Michael Caley (@MC_of_A)
16.3
21
James Fennell (@jfsports1)
16.6
22
James Yorke: (@jair1970)
16.9
23
Soccermetrics (@soccermetrics)
16.9
24
Steve Lawrence POST (@stevelawrence_)
17.4
25
Luke Black (@CB4Luke)
17.4
26
Soccermetrics POST (@soccermetrics)
17.5
27
Andrew Beasley (@basstunedtored)
17.8
28
Transfer Price Index
18.3
29
Raw TSR (@jameswgrayson)
18.4
30
TSR CEDE (@the_woolster)
18.5
31
CQR+ POST (@The_Woolster)
18.6
32
CQR+ (@The_Woolster)
19.0
33
NBC: Joe Prince-Wright (@JPW_NBCSports)
11.4
34
NBC: Nick Mendola (@nicholasmendola)
11.5
35
BBC: Phil McNulty (@philmcnulty)
12.7
36
International Business Times (@jasonlemiere)
13.4
37
Independent: Jack Pitt-Brooke (@jackpittbrooke)
13.8
38
Racing Post: Mark Langdon (@marklangdon)
13.9
39
NBC: Mike Prindiville (@mprindi)
15.2
40
Mirror: Robbie Savage POST (@robbiesavage8)
15.6
41
NBC: Richard Farley (@richardfarley)
15.7
42
Independent: Glenn Moore POST (@glennmoore7)
15.8
43
Sports Illustrated: Andy Glockner POST (@andyglockner)
16.1
44
NBC: Duncan Day
16.6
45
NBC: Kyle Bonn (@the_bonnfire)
17.1
46
BT Sport: Michael Owen (@themichaelowen)
18.4
47
BT Sport: Mike Calvin (@calvinbook)
18.6
48
Yahoo Sports: Martin Rogers (@mrogersyahoo)
18.7
49
Independent: Glenn Moore (@glennmoore7)
18.8
50
Independent: Paul Newman
18.9
51
Manchester United: Mark Thompson (@Etnar_UK)
13.0
52
Liverpool: Dick Bustin (@dickbustin)
13.0
53
Crystal Palace: Edward Porter (@elbakantowin)
14.7
54
Sam Hoar
17.4
55
Liverpool: Steven Maclean POST (@daskopital)
18.3
56
Manchester City: John Stanhope (@watchthepost)
18.5
57
Newcastle United: Dan Wilson (@sirdanwilson)
19.1
58
Liverpool: Steven Maclean (@daskopital)
19.2
59
Crystal Palace: James Mitchell
20.5
60
Liverpool: Mohamed Mohamed POST (@SvenFMS1TV)
21.1
61
NAÏVE 2014-2015
12.5


