NFL has ‘fairest’ pay distribution among the world’s major sports leagues
By Nick Harris
2 April 2010
Average pay across America’s NFL differs less between its richest and poorest teams than in any other major sports league in the world, according to sportingintelligence’s Annual Review of Global Sports Salaries, published today.
The study calculates pay at more than 200 teams across 10 leagues including in the richest leagues in football, gridiron, baseball, cricket, basketball and ice hockey.
In the period under review in the NFL, the highest-paid team by average player salary (not total roster bill) earned just 1.86 times as much as the lowest-paid team. The highest-paid team were the Dallas Cowboys and the lowest-paid were the Baltimore Ravens.
At the other extreme, the best-paid team in Scottish Premier League football, by average salary, earned 31.4 times as much as the worst-paid team in the season under review.
The NFL season considered was the 2008-09 season ending with the 2009 SuperBowl. It was calculated that the NFL’s best-paid players were the Dallas Cowboys, earning £1,685,499 ($2,762,294) per player each that year, or £32,404 ($53,121) per week on average.
The exchange rate used for the purposes of dollar-to-pound conversions was $1 = £0.61.
In the same season, it was calculated that the Baltimore Ravens were the lowest-paid team, by average pay, earning £907,140 ($1,487,114) per year each on average, or £17,445 ($28,598) per week.
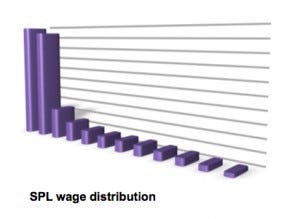
Hence the ratio between the best paid (£1.685m) and worst paid (£907,140) was 1.86 to 1. The graphic (above, left) illustrating the pay distribution in the NFL is taken from the report and each block represents one of the NFL’s 32 teams, from the Cowboys (far left) to the Ravens (far right). The second graphic, at the bottom of this page, shows the wage distribution in the SPL. The full report includes league-by-league explanation and analysis.
.
The comparative ratios across all 10 leagues reviewed were calculated at:
1.86 to 1 in NFL American football
2 to 1 in NBA basketball
2.06 to 1 in IPL cricket
2.36 to 1 in NHL ice hockey
2.9 to 1 in NPB Japanese baseball
4.43 to 1 in MLS soccer
7.02 to 1 in English Premier League football
9.7 to 1 in MLB baseball
15.4 to 1 in Serie A Italian football
31.4 to 1 in SPL Scottish football
.
It is well-established that star players in most teams earn significantly more than other team-mates; that is true in all sports. The sportingintelligence review takes a broader approach than individual pay - which in some leagues, especially soccer, is rarely if ever available - to try to ascertain the average wage across each “first team” squad / roster as applicable.
An extract from the report showing the top 12 best-paid teams can be seen here, accompanying our earlier story about the best-paid teams in the world.
The Dallas Cowboys’ No1 ranking within the NFL was good enough only to place them at No65 in sportingintelligence’s full list of 211 teams under consideration for this review.
The report compares pay in the Premier League, the NBA, MLB, the IPL, the NFL and the NHL, and also includes Japan’s NPB baseball league as the highest paying sports league in Asia (the newcomer IPL aside), as well as Serie A, the world’s second highest paying football league. Football leagues from the USA (MLS) and Scotland (SPL) are included too as representatives of “small” leagues from the world’s most popular game.
The most recent completed season was considered in each case where the full data set of information for all teams was available at the compilation cut-off point: the end of 2009. We have calculated some newer figures for some teams in some sports, and these are added to our database (more information here) as available, but only “whole league” data is included in the report.
Why? Because the review’s major aim, aside from trying to find a comparison in pay between sports, is to consider how pay affects performance. For that, whole data sets are needed for each league, and seasons need to have been completed.
This website will carry further features and analysis on the findings and related areas in the coming weeks and months but the relationship between cash and success is clearly defined in most sports, less clearly in others, including the NFL. The Ravens in 2008-09, for example, reached the AFC Championship game (effectively the NFL’s semi-finals) despite being the lowest-paid team by average earnings.
The figures used in the review are from the 2009 season in MLB, the MLS, the NPB and the IPL; from the 2008-09 season in the NBA, the NHL and the NFL (ending with the 2009 Super Bowl), and from the 2007-08 season in the English Premier League, the SPL and Serie A.
Thus the 31.4 to 1 ratio in the SPL was between the SPL's No1 payers that season, Rangers (average pay £890,270 per year / £17,121 per week) and the No12 payers, Gretna, who were enduring financial meltdown and have since gone bust and out of business. The report calculated Gretna’s average pay at £28,378 that season, or £546 per player per week, in a campaign where money was so tight it literally ran out.
Although that was an extreme season for the SPL, it holds true that in any given season in Scotland there will be a massive disparity between the top two clubs - Rangers and Celtic - and the lowest paid. That’s a simple product of having two giants in a 12-team league that also includes relative minnows.
Sportingintelligence’s home page today
.

.
.
.
.
.
.
.
.
.
..


