Everton have upper hand in financial mid-table tussle with Hammers
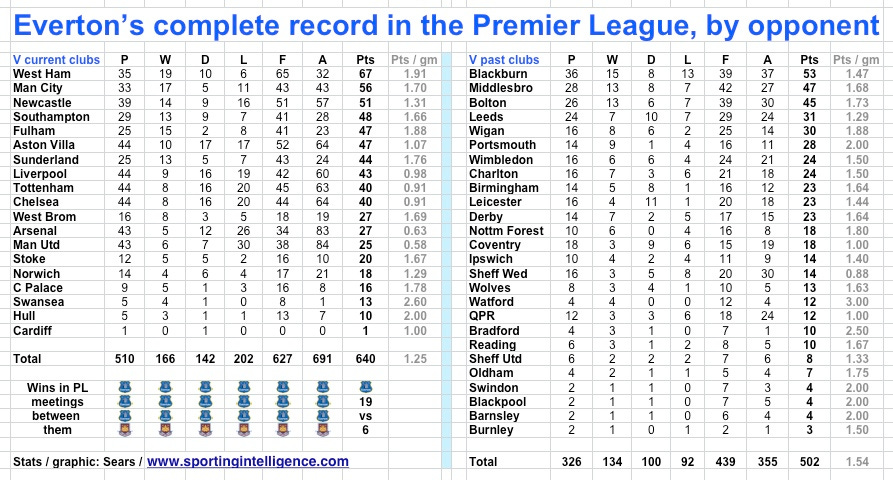
By Brian Sears 28 February 2014 Everton will start the weekend 11 points outside the Champions League qualification spots, albeit with a game in hand on fourth-placed Liverpool, and are now outsiders to reach Europe's top table for 2014-15. But their home form and their historical record against Saturday's opponents West Ham both suggest they should prosper on Saturday. They have won eight, drawn three and lost just one of the 12 home league games this season to give them a better home record than any other team in the Premier League outside the current top four. And though West Ham rallied from a woeful patch to win all four of their PL games in February, Everton's head-to-head PL record against the Hammers is better (in total points won) than against any other team. See the table below for Everton's PL record opponent by opponent. Everton have now won their last three Premier League games home and away against West Ham and are undefeated in the last 11 (seven wins, four draws). That last West Ham win in this fixture was on 21 April 2007 with Bobby Zamora scoring the only goal of the game at Upton Park. Our table shows that throughout the Premier League era no other club has provided Everton with more Premier League points than have West Ham and that's in spite of meeting some other clubs plenty more times. Everton can look back on 19 wins over West Ham in 35 games - more than against any other club and the 65 goals scored is also their top haul. Article continues below (click on table to enlarge)

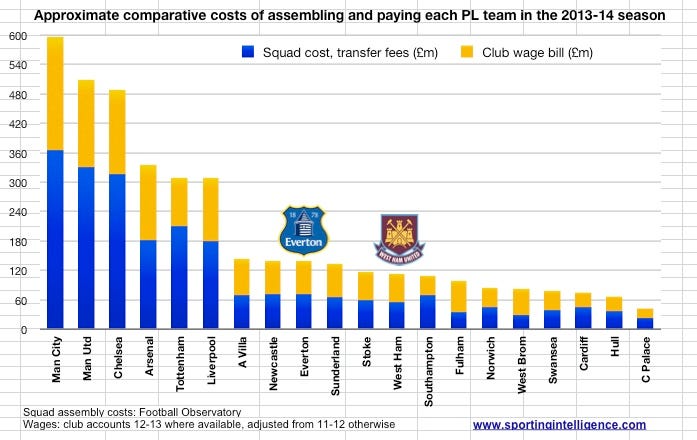
. As always a table throws up interesting side-line statistics. There's just one PL club past or present that Everton have a 100 per cent record over: Watford, with four wins from their four PL games. And what a draw Everton's games with Leicester turned out to be; 16 games and 11 ending level. Now that's a fixture that could be revived next season. Today's second graphic demonstrates how both Everton and West Ham are distinctly mid-table in the current Premier League in a financial sense - adding the cost of the assembly of their current squads to the amount of wages they're paying their respective groups of players. Article continues below

. The methodology used here takes the amount spent on assembling the first-team squads for each Premier League club for 2013-14 (data from the Football Observatory, here) and adds the wage bill for each club (total wage bill as listed in most recent accounts, 2012-13, or the season earlier and adjusted). Is this an imperfect measurement of a club’s financial power? Of course, there is no perfect measurement, not least as spending is dynamic. Does this graphic give a clear like-for-like comparison of resources? Absolutely. Manchester City’s squad cost £362.6m in fees to assemble for example, and their latest total club wage bill (a large percentage of which goes on players) was £233m, for a total spend of £595.6m. Manchester United, Chelsea and Arsenal round out the top four, and frankly from an economic point of view those four clubs ‘should’ finish in the top four. (But quite possibly won’t as United are in transition). So where ‘should’ Everton be? Around ninth, with West Ham around 12th. It could yet transpire that both punch slightly about their weight this season, whatever happens at Goodison. More on Man City / Chelsea / Man Utd / Arsenal (or search for anything else in box at top right) More from Sears Follow SPORTINGINTELLIGENCE on Twitter


