


DATA DIVE: the finances of European club football; average pay in 20 leagues revealed
UEFA's latest "benchmarking" report looks at the business of 700+ top-flight clubs across UEFA's 55 nations, and using official data, I tell you things the report doesn't.

It was in January 2017 that UEFA’s president Aleksander Ceferin openly acknowledged that a small group of “super clubs”, including five from the Premier League, were becoming so wealthy that nobody else had any realistic chance of catching them financially.
This warning came in a remarkable UEFA “benchmarking report”, a fascinating and detailed document, based on official data provided directly to UEFA by top-flight clubs across Europe. I wrote about that report at the time and have paid close attention to subsequent editions.
These reports contain thousands of words, plus numbers and graphics, that, if you spend time digesting them, paint a clear picture of the way the game is heading.
One irony now of the 2017 report is UEFA have since been forced to cede more and more power to the biggest clubs it was warning about back then. In turn this has led to the restructuring of European club competitions, and more games, and more ways those same clubs have been able to stretch their financial advantage even further.
A handful of leagues (the “Big 5”) now overlook a chasm between themselves to the rest. And actually the chasm between the English Premier League and even those other ‘big’ leagues continues to grow.
Did you know, for example, that the average player wage per year in the Premier League is around £4,902,800, or possibly a bit higher? That is almost twice as big as the average salary in the next richest league, Spain’s La Liga.
In the 20th highest-paying top division in Europe - Norway’s Eliteserien - the average is around £92,750. That figure includes all basic pay, plus annualised signing-on fees, plus bonuses and benefits.
I’m not going to argue that a wage of north of 90k per year is small beer, even in expensive Norway.
But Norwegian clubs have played in all three UEFA club competitions this season (Champions League, Europa League and Conference League, whether in qualifying or later) and the odds are stacked against them when Norwegian top division players earn, on average, 1/53rd the salaries of English top-flight players, some of whom are competing in the same events.
Those top-flight players in England earn 21 times as much, on average, as Danish top-flight players, and 17 times as much as Scottish Premiership players, and 11 times as much as players in the Netherlands’ Eredivisie.
There are nuances to take into consideration, of course, and we’ll return to those shortly.
But we know all these numbers not because they are laid out in a neat table in the most recent benchmarking report but because the report give us all the official numbers we need to do the maths. And yes, I will give you a neat table later.
This piece today focuses on various aspects of the most recent report just published by UEFA, which is, as ever, chock full of detail on everything from club revenues and TV deals to commercial deals, attendances, transfers, ownership, costs (not least wages), profits and losses, insolvencies, takeovers and much more.
I don’t have the time or space to analyse all of that here but I do recommend the report; the full PDF is below or there’s an online interactive version here. Depending on where you’re based in Europe or which club you support, you’ll probably be staggered by quite the financial disparities across the continent.
The data in the report comes from the last full season for which numbers are available for all 700+ clubs under review, or namely the 2022-23 season, although figures for most of the biggest clubs have been given to UEFA for 2023-24 and are scattered across the report.
The main areas I’ll cover today are:
How revenues across Europe have bounced back strongly since COVID turned the world upside down. Yet the gap between the richest and the rest continues to get bigger.
How there are now six English clubs in the world’s richest top 10, plus two from Spain and one each from Germany and France; and 11 “super clubs” up from the nine mentioned in 2017. But there is now a gulf even between those 11 and the next richest clubs.
How TV revenue growth has largely stagnated or even gone into reverse in most of the the biggest leagues in recent years, even as it has grown in many smaller nations, albeit from a low base.
How commercial revenue increases at the biggest clubs are impacting the polarisation of wealth across Europe, to an even greater extent than TV money. Within that sector, gaming and betting firms are now the No1 suppliers of shirt sponsorship income in most countries.
How wage growth remains heading upwards, albeit at less worrying rates than at points in the recent past.
Record revenues as football has COVID bounce-back
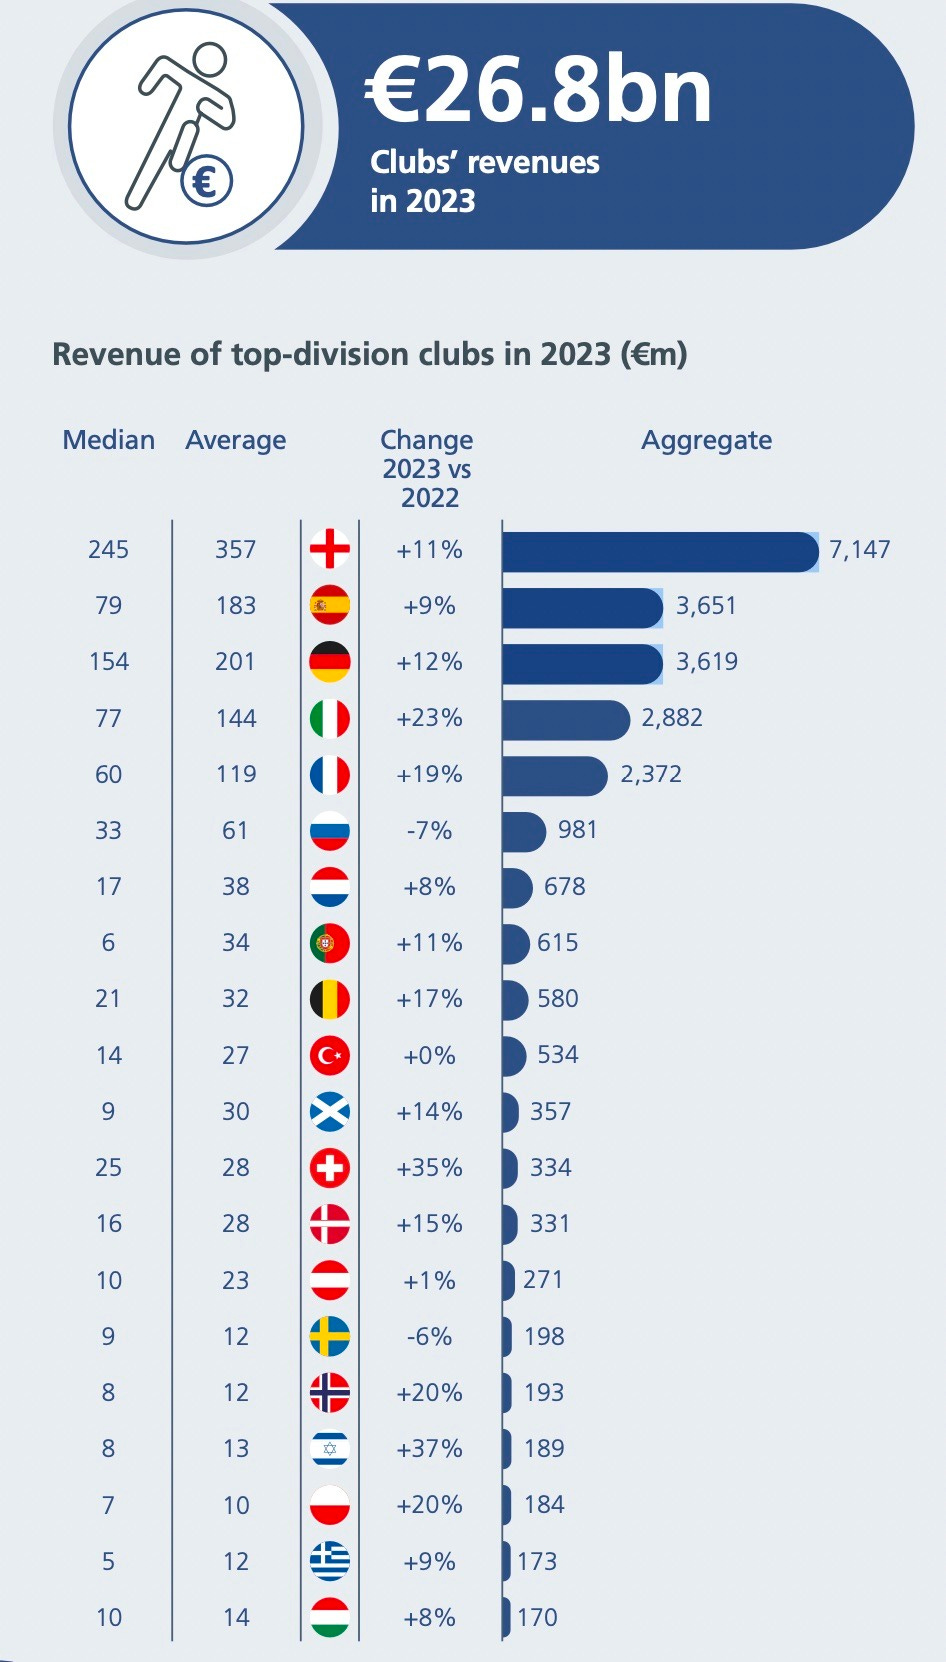
In 2023, the 700+ clubs under scrutiny collectively increased their revenues by a record €2.9bn to €26.8bn, with 2024 set to have the second highest revenue increase on record despite slow TV growth.
I’ll let various graphics speak for themselves in this piece, because mostly they tell you the obvious stories at a glance, as in the first graphic below.
This shows the 20 richest top divisions in Europe by the collective income of their clubs.
The English Premier League’s total was €7.147bn in the period under review (average €357m per club). That average per club is precisely the same as all of Scotland top division combined, and more than all the top-flight clubs in Switzerland (and many other divisions), combined.
The better news for most of the other leagues is strong year-on-year growth in 17 of the top 20 leagues, with the exceptions being Russia and Sweden (both down) and Turkey (static).
The richest clubs in the world, and a gulf even among those
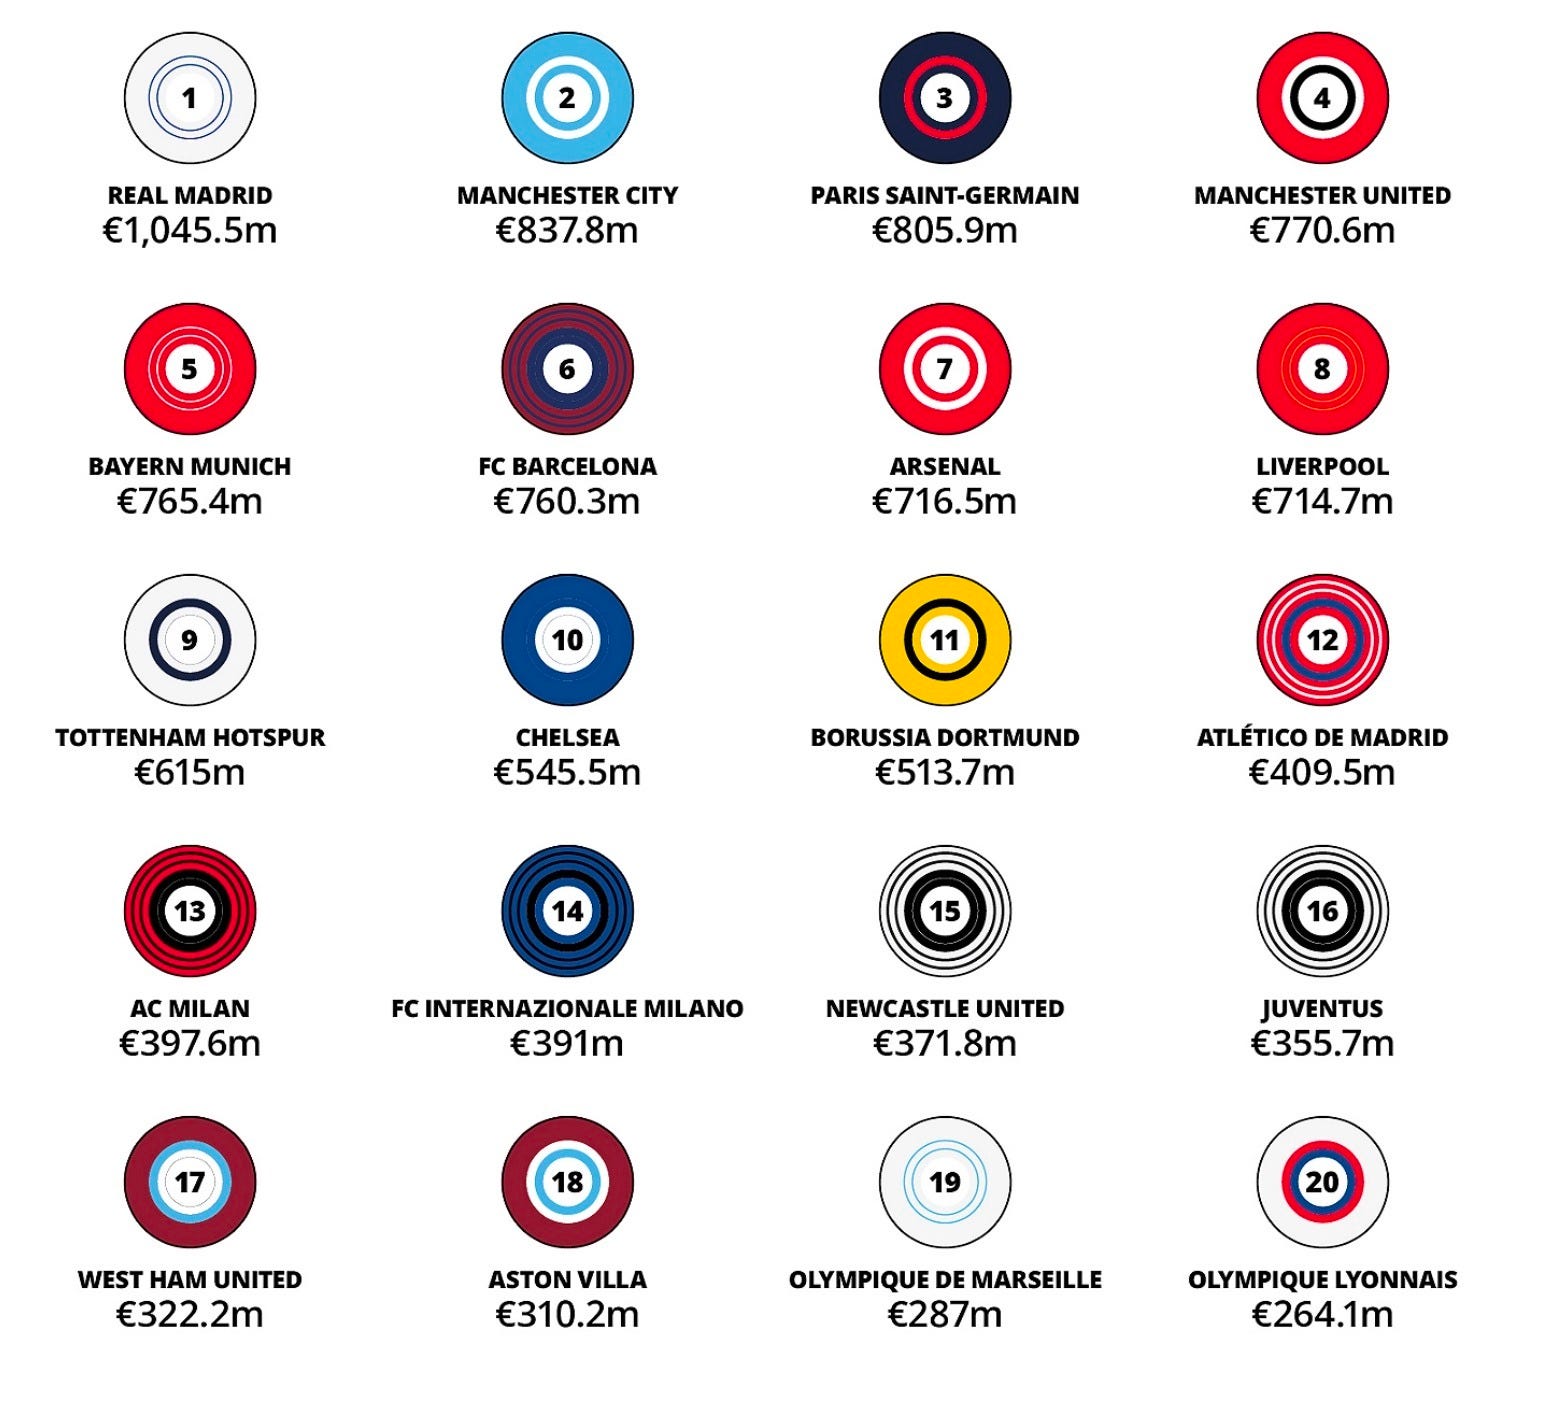
The UEFA report notes that even within the richest 20 clubs in the world - and this is using up-to-date financial figures from 2023-24 - there is a gap, and a big gap, between the 11 clubs that are now the “super clubs” (in revenue terms) and the rest.
The next graphic is taken from Deloitte’s most recent ‘Money League” of the world’s richest clubs (read that online here). Note that there is now a revenue gap of more than €300m between the eighth richest club in the world (Liverpool, €714.7m) and the 12th richest (Atletico, €409.5m).
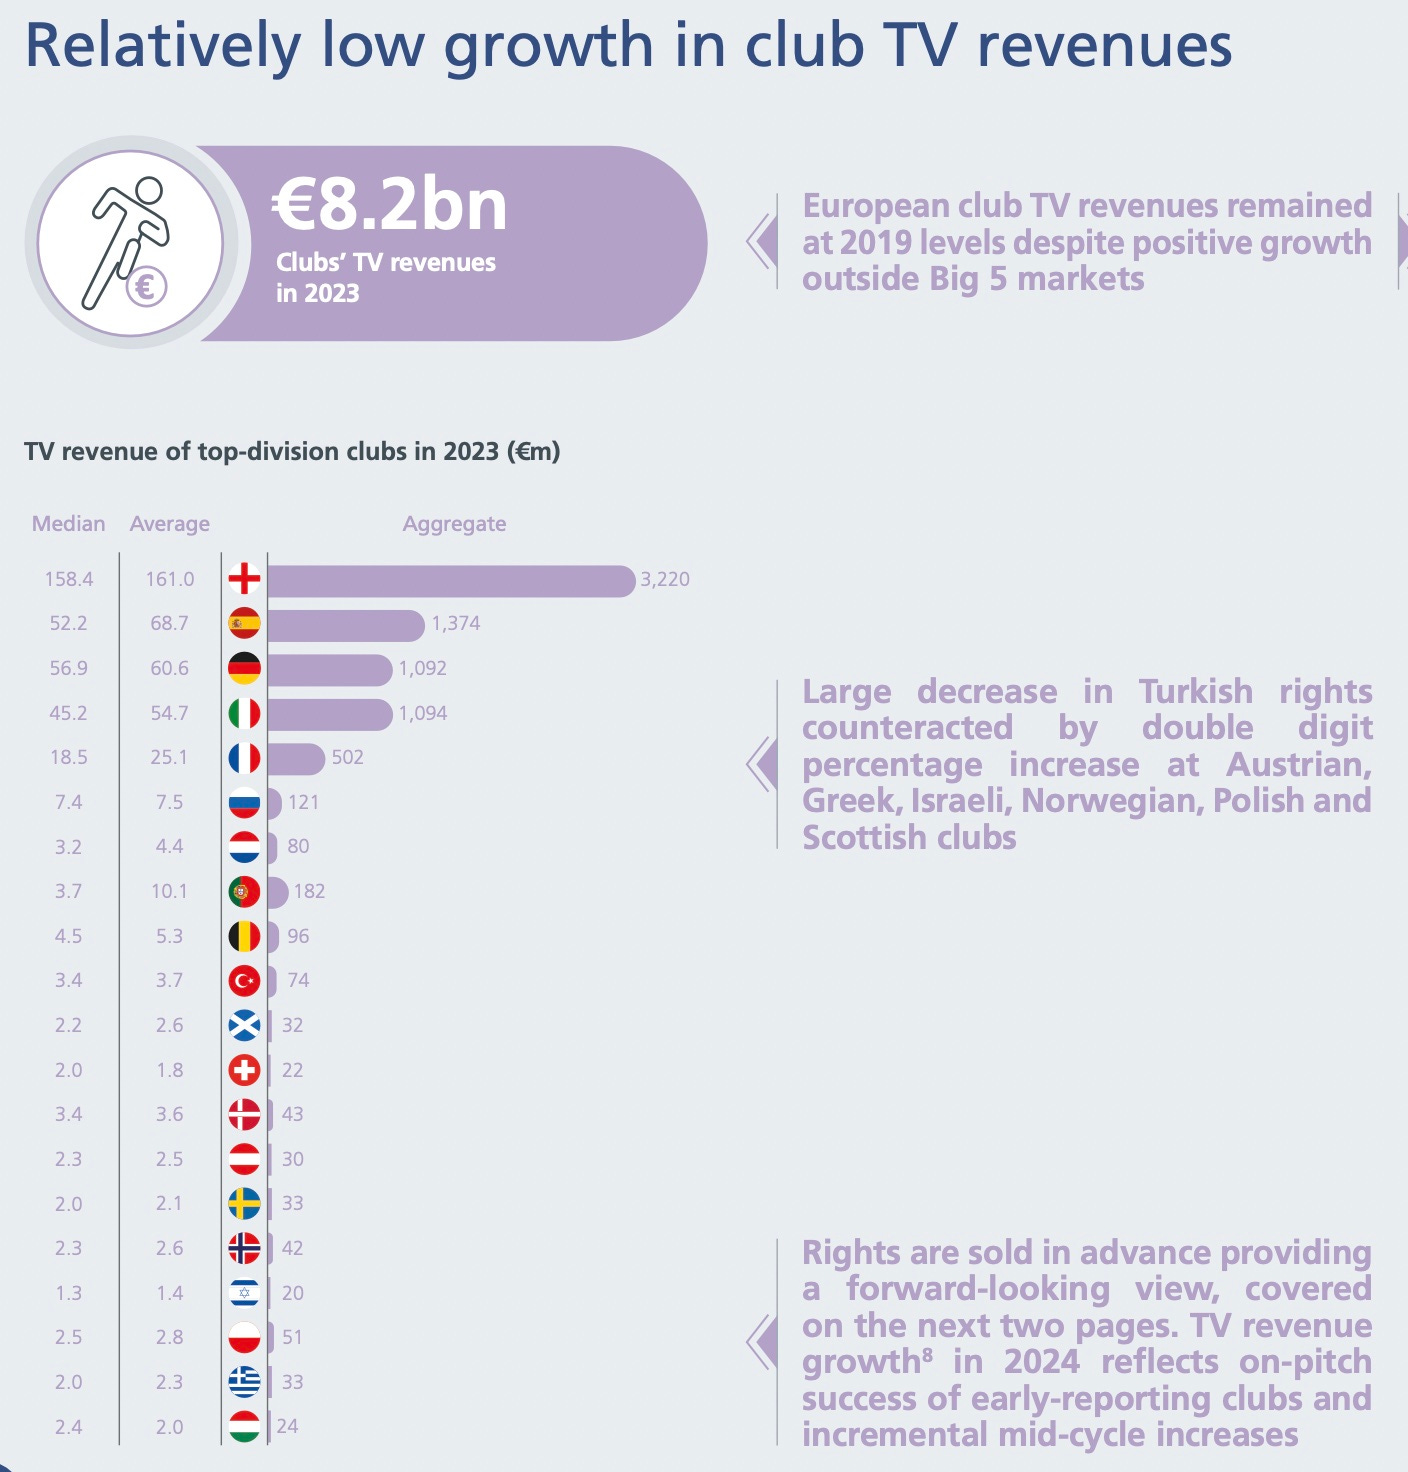
Low growth in TV revenues, mostly
English Premier League clubs make 100 times more money from TV deals that their Scottish counterparts. They make more than six times as much from TV as their French counterparts, who in turn make between five times as much and 20 times as much as the rest of Europe’s top leagues outside the “Big 5”.
Having said that, the French league’s TV deals are an ongoing car crash.
This next graphic tells its own story. And if you go to page 19 of the PDF document downloadable above, there is better news from smaller leagues of growing TV revenues, albeit from low bases.
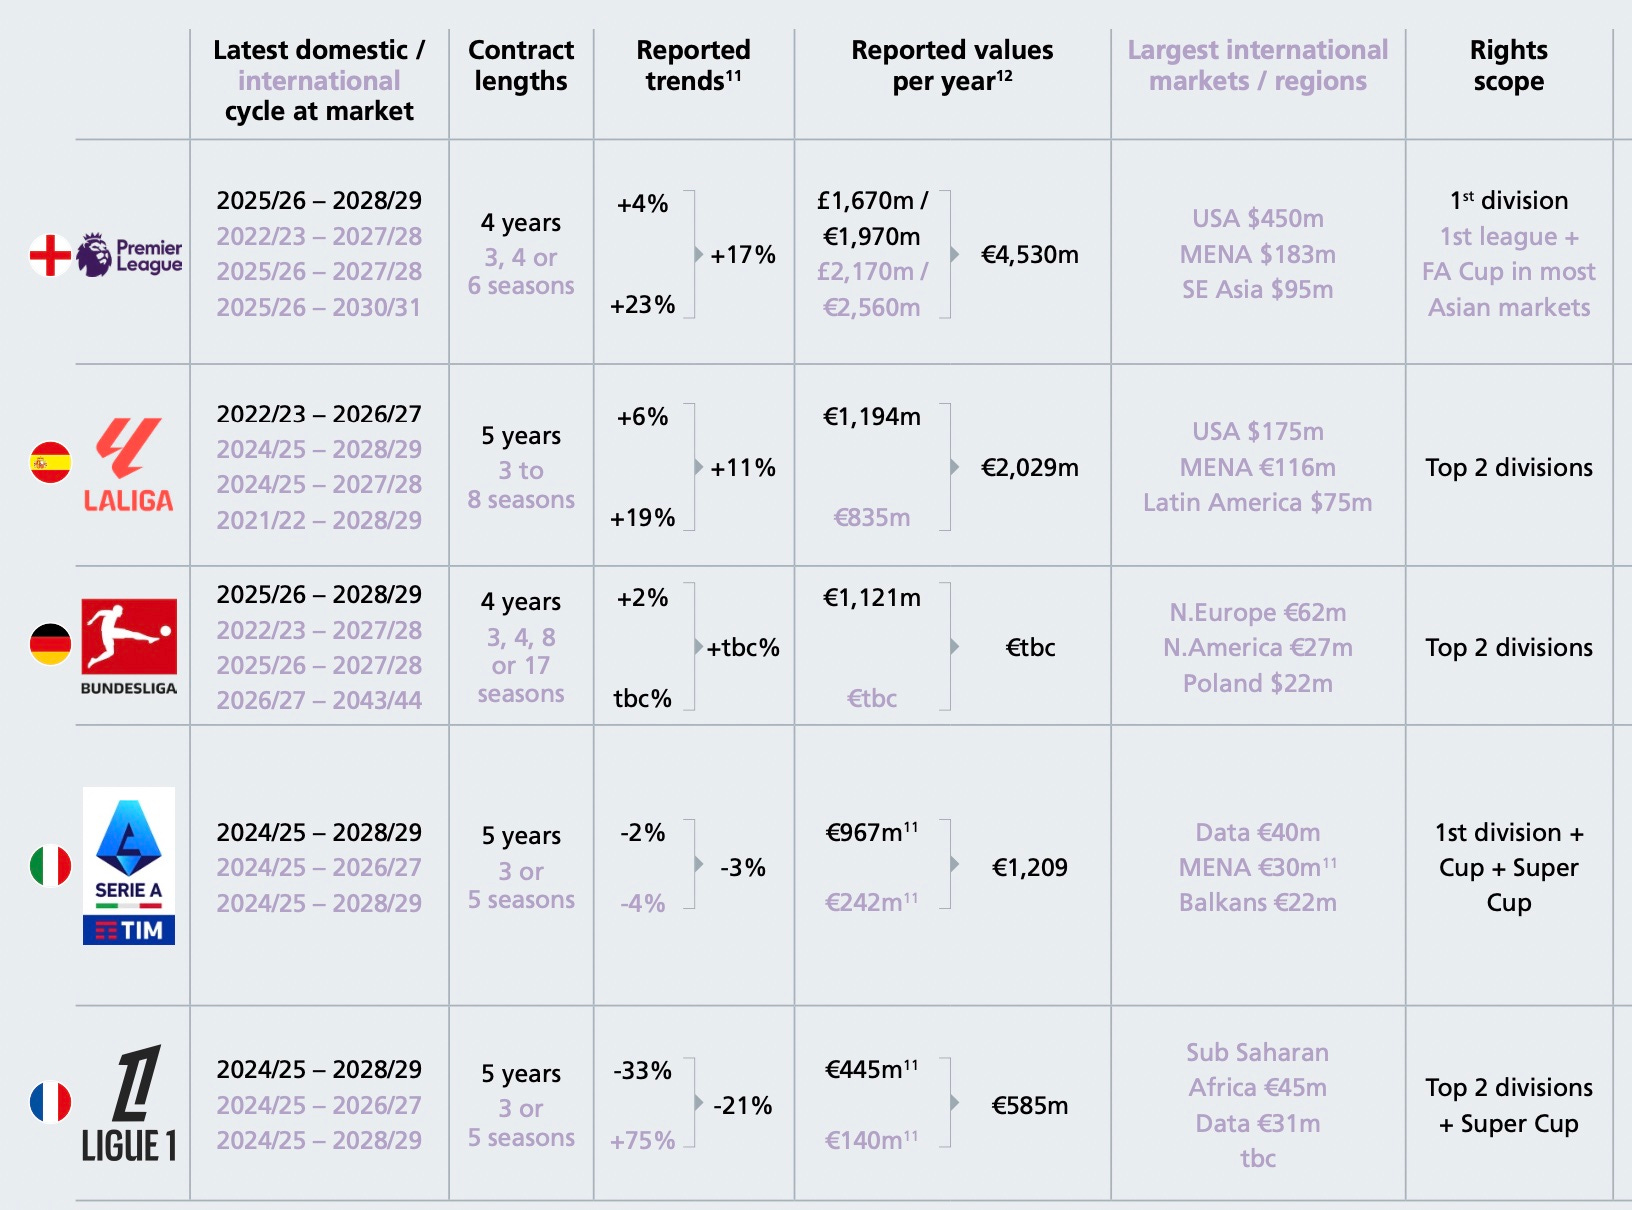
While we’re on the subject of TV deals, here is a breakdown of the ‘Big 5’ revenues from TV, domestically and internationally.
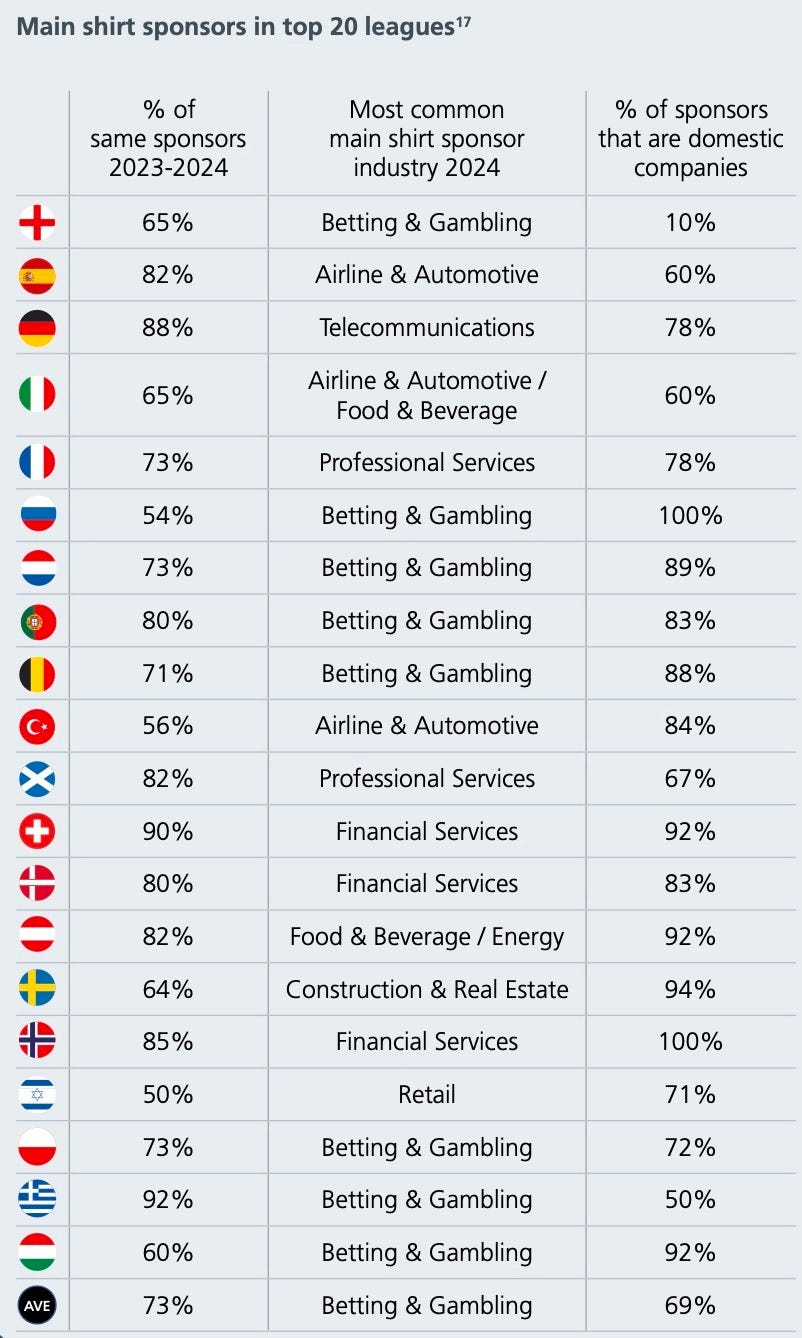
Addicted to betting and gambling sponsors
It’s not a new story but betting and gambling sponsors are the most common shirt sponsors across the 700+ clubs in Europe’s top divisions.
A lot of leagues have a majority of sponsors from companies in their domestic markets, with Norwegian clubs all having such shirt sponsors.
At the other extreme, it’s not really a surprise that the English Premier League - as the most-watched league globally, with six “super clubs” with fans scattered across the world - attracts sponsors with “global” products they want to market globally.
These include airlines, insurance giants, and, erm, Betano, BJ88, Hollywoodbets, Net88, Stake.com, SBOTOP, BC.GAME, Kaiyun, Rollbit, Betway and DEBET, the last 11 of those betting or gambling sites with current PL front-of-shirt deals.
Staying on commercial income, page 21 of the full report available above highlights the steep growth and polarisation of commercial revenues over many years. The top commercial tier of clubs now generates three to four times more than the highest commercial figure in 2009.
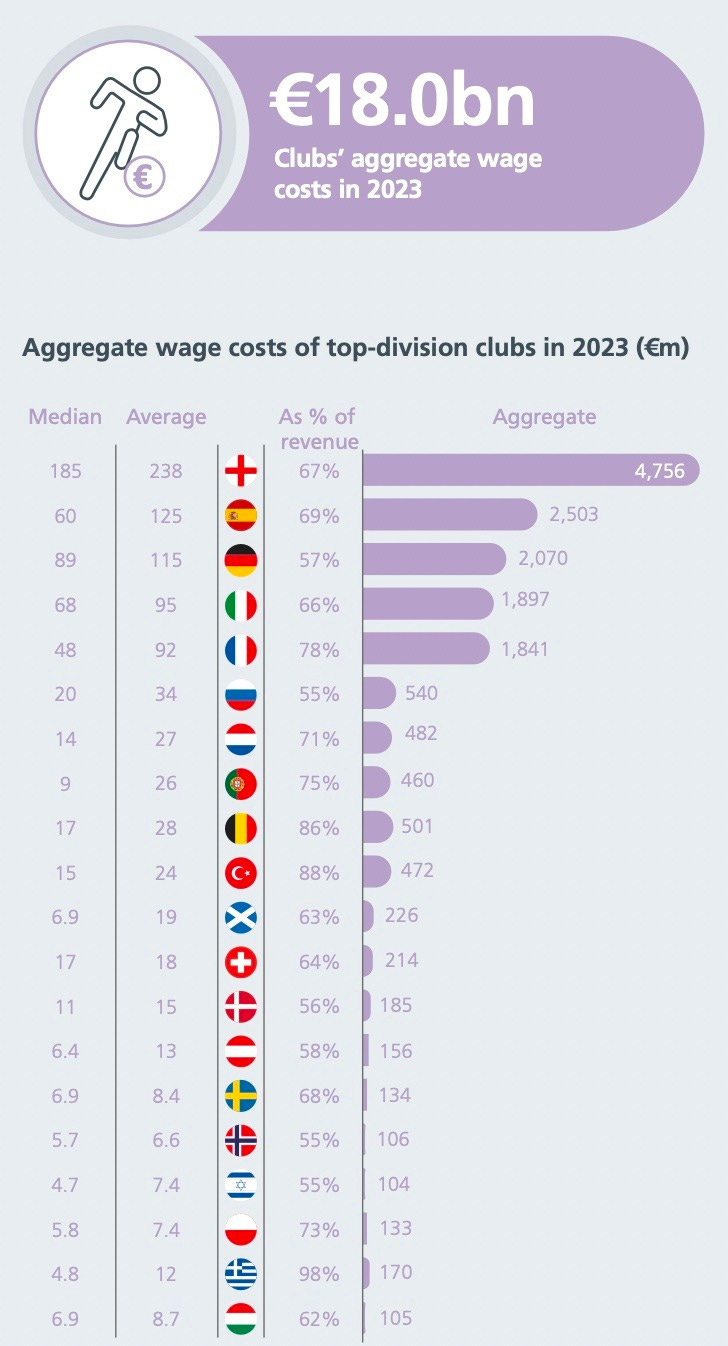
Wages: a gulf
The period under review in the report recorded wages at the 700+ clubs of €18bn combined, of which €13.2bn was player wages.
This is information not generally available anywhere else - by which I mean a specific breakdown of total wage bills and the portion paid to players - or at least it’s not provided by the vast majority of clubs in their annual financial statements. They do however provide it to UEFA.
Here’s the graphic that tells you at a glance the disparity in wages across Europe’s top leagues.
Here’s the graphic that gives you the precise figure for player wages by league.
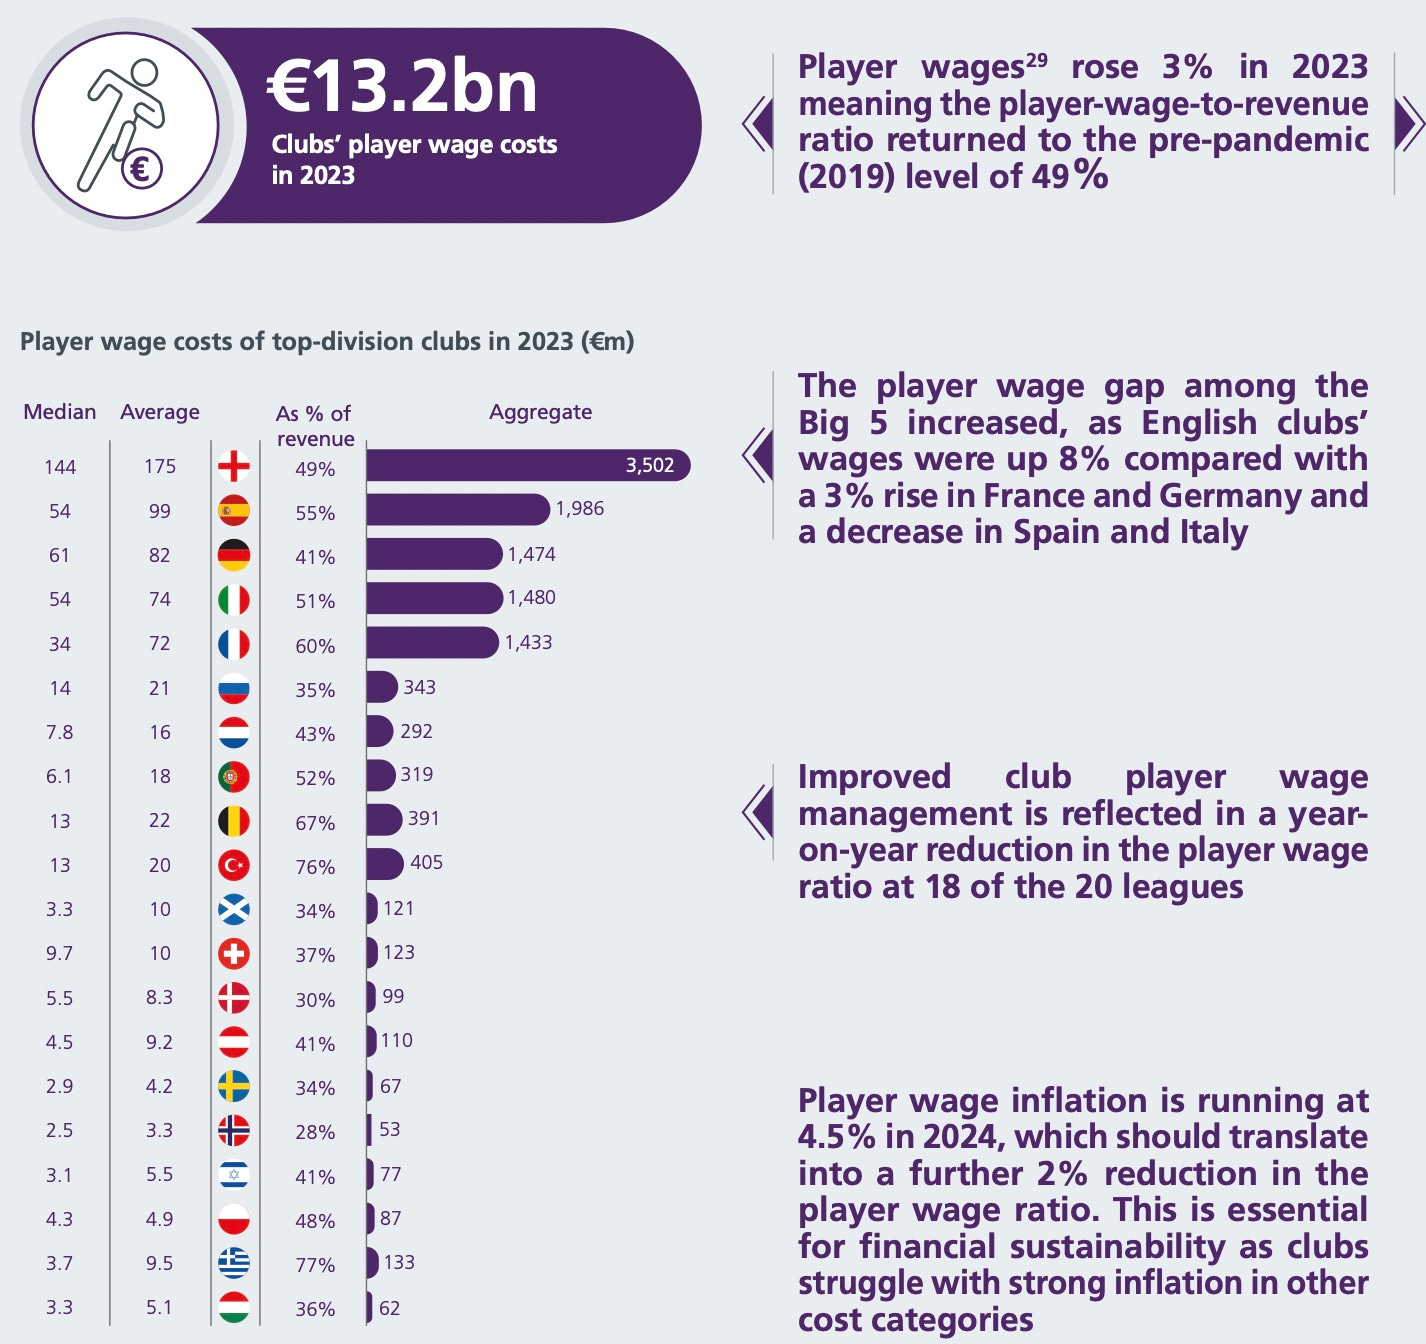
Using the information provided by UEFA, and some solid assumptions based on working on wage projects in football for the past 25 years, below is a table of the average annual pay per player in each of Europe’s 20 richest leagues.